Recent projects
Kelly Meleshko
Data visualisation enthusiast based in NSW, Australia

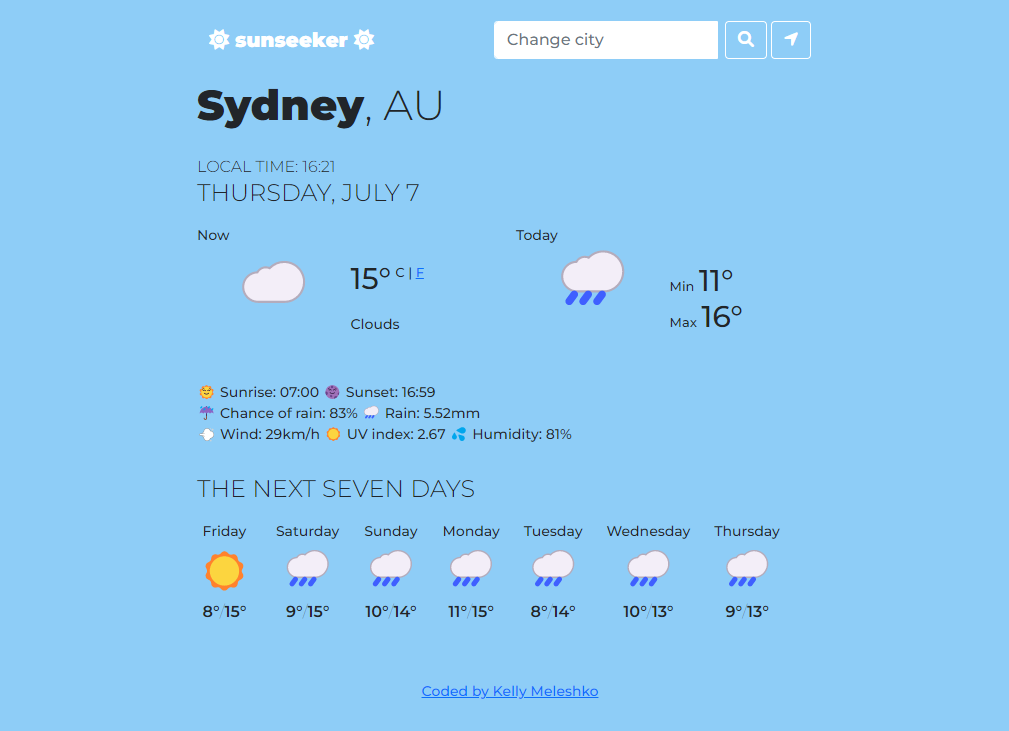
Weather app
This app was the final project for the SheCodes Plus workshop.
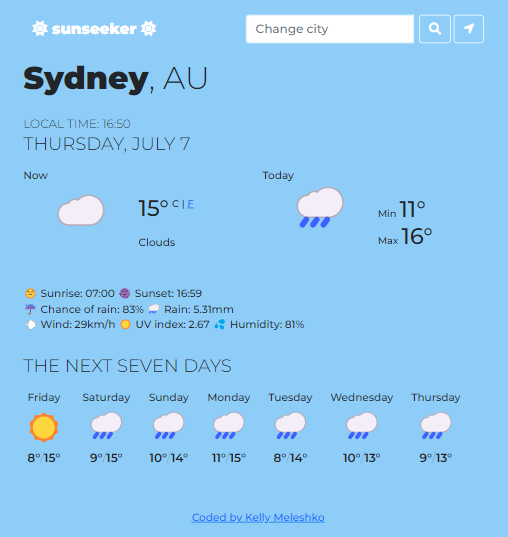
It fetches data from the OpenWeather API based on a city search or the user's current location. Although not required by the project, I set the time and date to match the timezone of the location being searched for rather than the user's timezone. For example; it is 9am in Sydney, Australia but when I search for Kyiv the time in the weather app shows me that it is 2am in Kyiv. I did this because I think the current weather conditions are more meaningful if you have the current time.

I also added a night theme to the project, which is conditional on the local sunrise and sunset time. Again, using the Sydney versus Kyiv example, at 9am in Sydney the site would have a light blue background and black text. A search for Kyiv (where the local time was 2am) would change the page to a navy blue background and white text.

Bluey fan site
If you have small children and you don't know about this Australian cartoon - well, your life is about to change.
I built this site as the final project for the SheCodes Basics workshop. It features basic HTML, CSS and Javascript.
When I built this I hadn't yet learnt about Bootstrap grids or Flexbox

Data visualisations
I am always looking for opportunities to visualise data, whether it be election results, Census data or even timelines.
I am interested in learning Python or R to build my expertise in this area. At the moment I use Datawrapper and Flourish. I have found my coding knowledge very useful in extending what's possible with these tools.
I wrote a story about election data which used extensive graphs and maps, but you must have a subscription to read it.
These are some of the visualisations I have created in my current role.